Introduction
Overview
Teaching: 30 min
Exercises: 0 minQuestions
What will I learn during this workshop?
Objectives
List the learning objectives of this tutorial
Present the data sets used in this tutorial
Present the strategy used to analyse the data sets
Table of contents
1. Overview
This tutorial will introduce you to Microbiota data analysis and guide you through the analyses, visualization and interpretation of microbial community composition and diversity.
2. Learning objectives
By the end of this tutorial you should be able to:
- Address sparsity, undersampling and uneven sampling depth using data filtering and normalization
- Define, calculate, and interpret alpha- and beta-diversity of microbial communities
- Visualize and interpret microbial community composition
- Generate and interpret multivariate analyses
3. Context, scientific question and data sets
3.1. Scientific context
Epilithic river biofilms are complex matrix-enclosed communities harboring a great diversity of prokaryotic and eukaryotic microorganisms. Deciphering the microbial community composition in river biofilms and identifying the impacts of environmental factors on these communities are of particular importance for attaining a better understanding of the functioning of riverine biofilms.
3.2. Scientific question
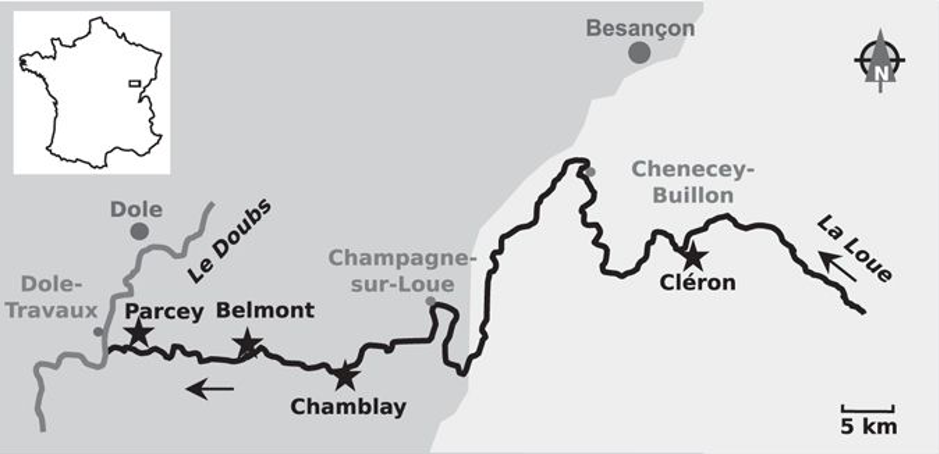
In this tutorial, we will investigate how bacterial communities within epilithic biofilms from the Loue River in France change along the river and over time (using a subset of the data previously published in Zancarini et al. 2017, Scientific Reports 7:4344. We will compare bacterial diversity and composition within biofilms harvested in two different sites (Cleron, located at the upstream area of the river, and Parcey, located at the downstream area of the river) and over the summer 2012 (i.e. July, August and September). For each site and harvesting time point, three samples were harvested. Then, DNA was extracted for each sample and the 16S gene was amplified and sequenced using 454-pyrosequencing.
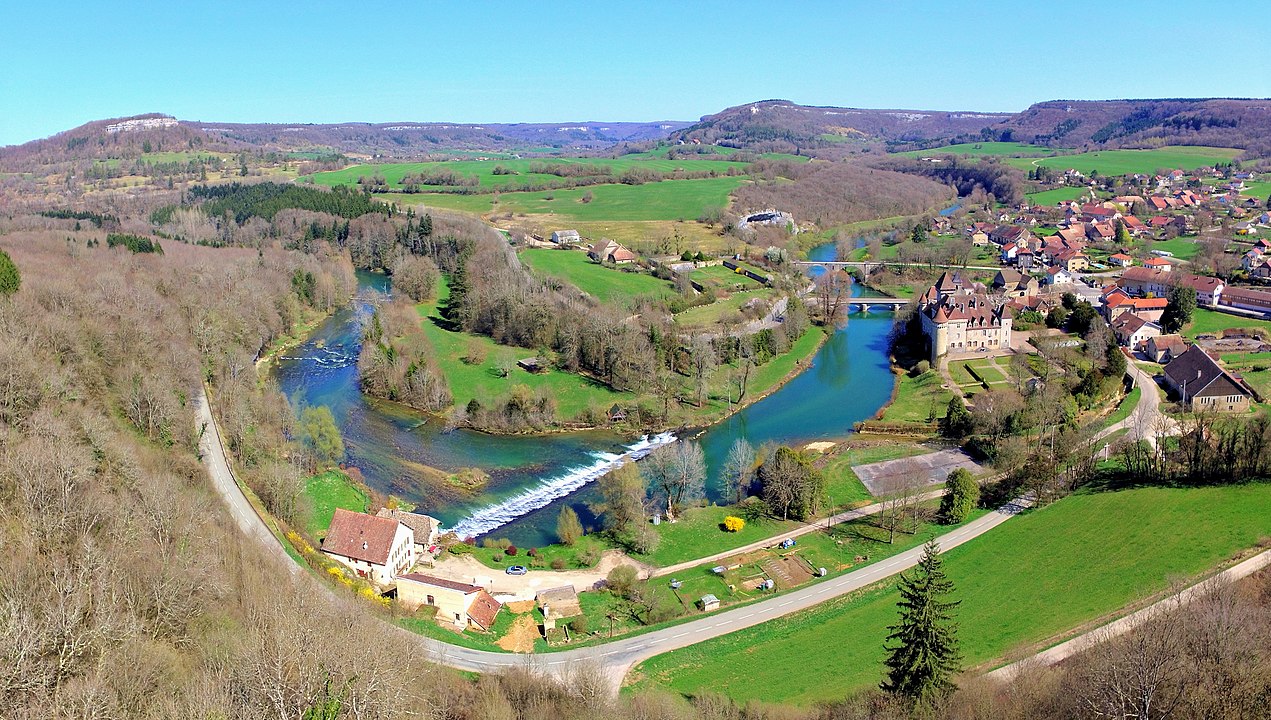
Below are displayed a map of the sampling sites (from Zancarini et al. 2017) and the Loue at Cléron (source Wikipedia).
3.3. Datasets
A first bioinformatical analysis was required to create the occurence table based on the raw sequencing data given by the sequencing company. Usually, the biom format is used as an output format for this first analysis. The biom format has been developed to support encapsulation of core study data (occurence table data and sample/observation metadata) in a single file. Similar to the biom format, the phyloseq format also uses a single file containing the three tables. Microbial ecologists usually use Vegan and/or Phyloseq packages to analyse the occurence table.
To limit the number of packages used in this tutorial, the data sets are not in biom format but in txt (tabulation separated values) and consist of three different data files which will be converted to a single phyloseq file format:
- An OTU table:
data_loue_16S_nonnorm.txt - A sample metadata table:
data_loue_16S_nonnorm_grp.txt - A taxonomy table:
data_loue_16S_nonnorm_taxo.txt
4. Strategy
We want to assess if there is any difference between bacterial communities within biofilms harvested in the upper (Cleron) and in the downstream (Parcey) area of the Loue River and over time during the summer 2012 (i.e. July, August and September). We will follow the following strategy:
- Explore the data sets and check data properties (sparsity and sequencing depth).
- Define, calculate and interpret alpha-diversity (i.e. Richness, Choa1, Evenness and Shannon indices).
- Filter the data and normalize the data by sample (i.e. correction for library size).
- Explore the beta-diversity using Principal Covariates Analysis (PCoA) and perform statistical tests to test differences among treatments.
- Visualize and interpret the bacterial community composition for the different treatments.
Teaching materials
This lesson has been formatted according to the Carpentries Foundation lesson template and following their recommendations on how to teach researchers good practices in programming and data analysis.
Key Points