01 Introduction
Overview
Teaching: 30 min
Exercises: 0 minQuestions
What can I learn by doing this RNA-Seq lesson?
What are the tools that I will be using?
What are the tidy data principles?
What is working in a more open way beneficial?
Objectives
Discover in what consists a typical RNA-Seq experiment.
Know what results a RNA-Seq experiment can (and cannot) yield.
Table of contents
What you will learn in this lesson
- What are the important things to know before doing an RNA-Seq experiment
- When should you perform a RNA-Seq experiment?
- RNA-Seq experiments have to comply with good experimental design practices just like any experiment.
- What are biological replicates and why are they important?
- How to assess the quality of my RNA-Seq experiment at the sample-level
- Using
FastQCto perform quality checks on each samplefastqsequencing file. - What are some count normalization methods? Why are RPKM, FPKM and TPM not adequate methods.
- Calculating
DESeq2size factors with R to compare potential bias between samples sequencing depth, etc. Understand why we need to normalise counts for sample-level QC. - Plot a scree plot from a PCA analysis to verify that the first principal components explain most of the total observed variation.
- Creating a PCA plot to visualise the grouping of samples in relation to the experimental factors being investigated.
- Using
- How to perform a differential expression analysis on RNA-Seq results using R
- Raw counts are used for differential expression not scaled counts.
- Creating a
DESeq2object requires 3 items: the raw gene counts, the sample to condition correspondence and a formula for testing. - How does the DESeq method works? What are the outputs obtained using
DESeq2?
- What are the typical outputs that one can obtain from a differential gene expression analysis?
- A table of genes being differentially regulated between two conditions.
- A volcano plot shows the relationship between \(log_{2}\) fold change and the adjusted p-value for each gene.
- How to go beyond a list of differential genes and interpret its biological meaning
- By performing an over-representation analysis (ORA), one can find pathways or categories where differential genes are significantly more abundant.
- By performing a gene set enrichment analysis (GSEA), one first ranks differentially expressed genes before comparing enrichment scores for whole pathways.
- How to perform transcriptomic and metabolomic data integration
- Perform gene identifier conversion to retrieve common metabolic identifiers such as Uniprot IDs or KEGG IDs.
- Overlay genes on a metabolic map with iPath 3.
- Search for enriched metabolic KEGG pathways and modules.
Dataset used
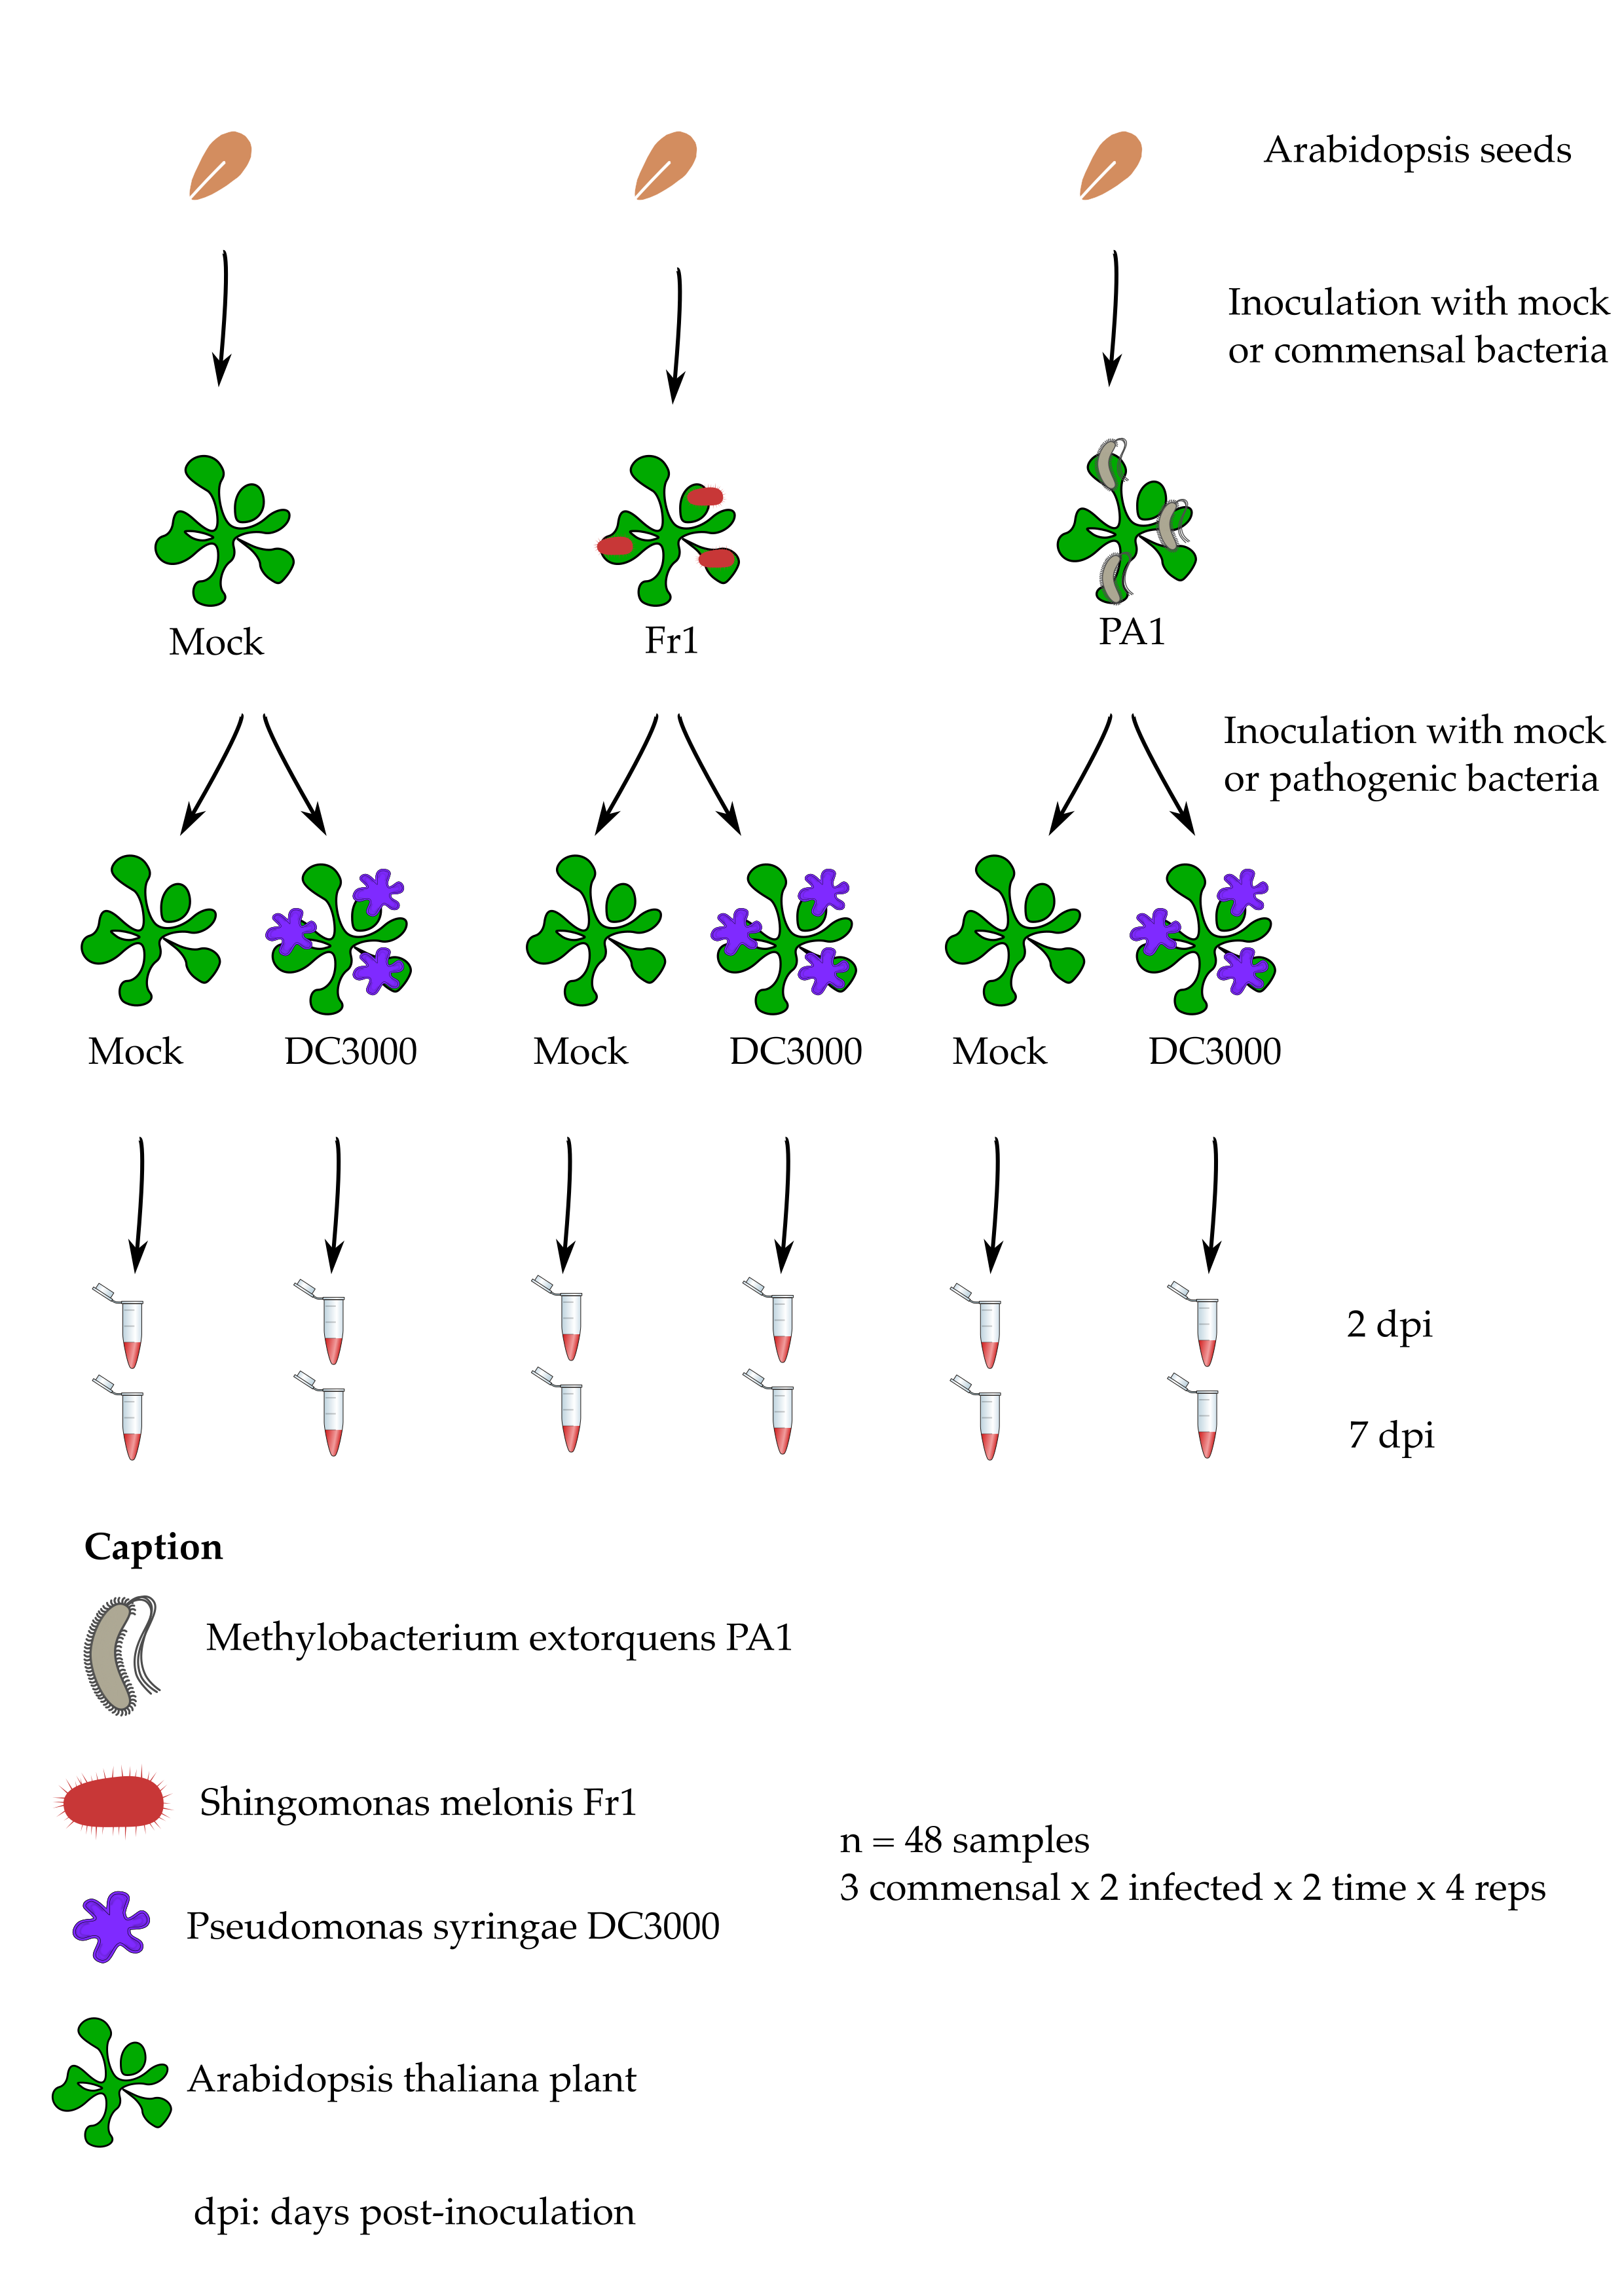
We will make use of a published experimental dataset from a study made on the small model plant Arabidopsis thaliana by Vogel et al. (2016). This study compares the response of 4 weeks old plantlets to different bacteria that live on the leaves of different plant species:
- A known foliar pathogen called Pseudomonas syringae strain DC3000.
- A commensal (“neutral”) bacteria called Methylobacterium extorquens strain PA1.
- A commensal (“neutral”) bacteria called Sphingomonas melonis strain Fr1.
The original sequencing files can be found on the Array Express database of the European Bioinformatic Institute by searching for the dataset accession number E‐MTAB‐4683.
Credits
Dataset
The original RNA-Seq dataset used comes from Vogel et al. 2016: https://doi.org/10.1111/nph.14036.
Teaching materials
This lesson has been formatted according to the Carpentries Foundation lesson template and following their recommendations on how to teach researchers good practices in programming and data analysis.
This material builds from a lot of fantastic materials developed by others in the open data science community. Most of the content derives from the Harvard Chan Bioinformatics Core which are greatly acknowledge for the quality of their teaching materials.
Key Points
An RNA-Seq experiment is also a normal experiment (control, treated, replication, etc.).
A canonical RNA-Seq experiment consists in RNA library preparation followed by bioinformatic analyses.”
RNA-Seq yields a snapshot of individual gene expression levels (count table).
Upon completion of the bioinformatic steps, the analysis of RNA-Seq results can be done using the DESeq2 R package.