09 Transcriptomic and metabolomic data integration
Overview
Teaching: 45 min
Exercises: 15 minQuestions
How can I map differential genes to metabolic pathways?
How do I retrieve KEGG identifiers given a list of gene identifiers?
Objectives
Retrieve common metabolic identifiers such as KEGG KO using the Ensembl API queried using the
biomartrpackage.Be able to use MapMan to generate pathway visualisations.
Table of Contents
1. Introduction
1.2 Setup
2. iPath webtool
2.1 Tool presentation
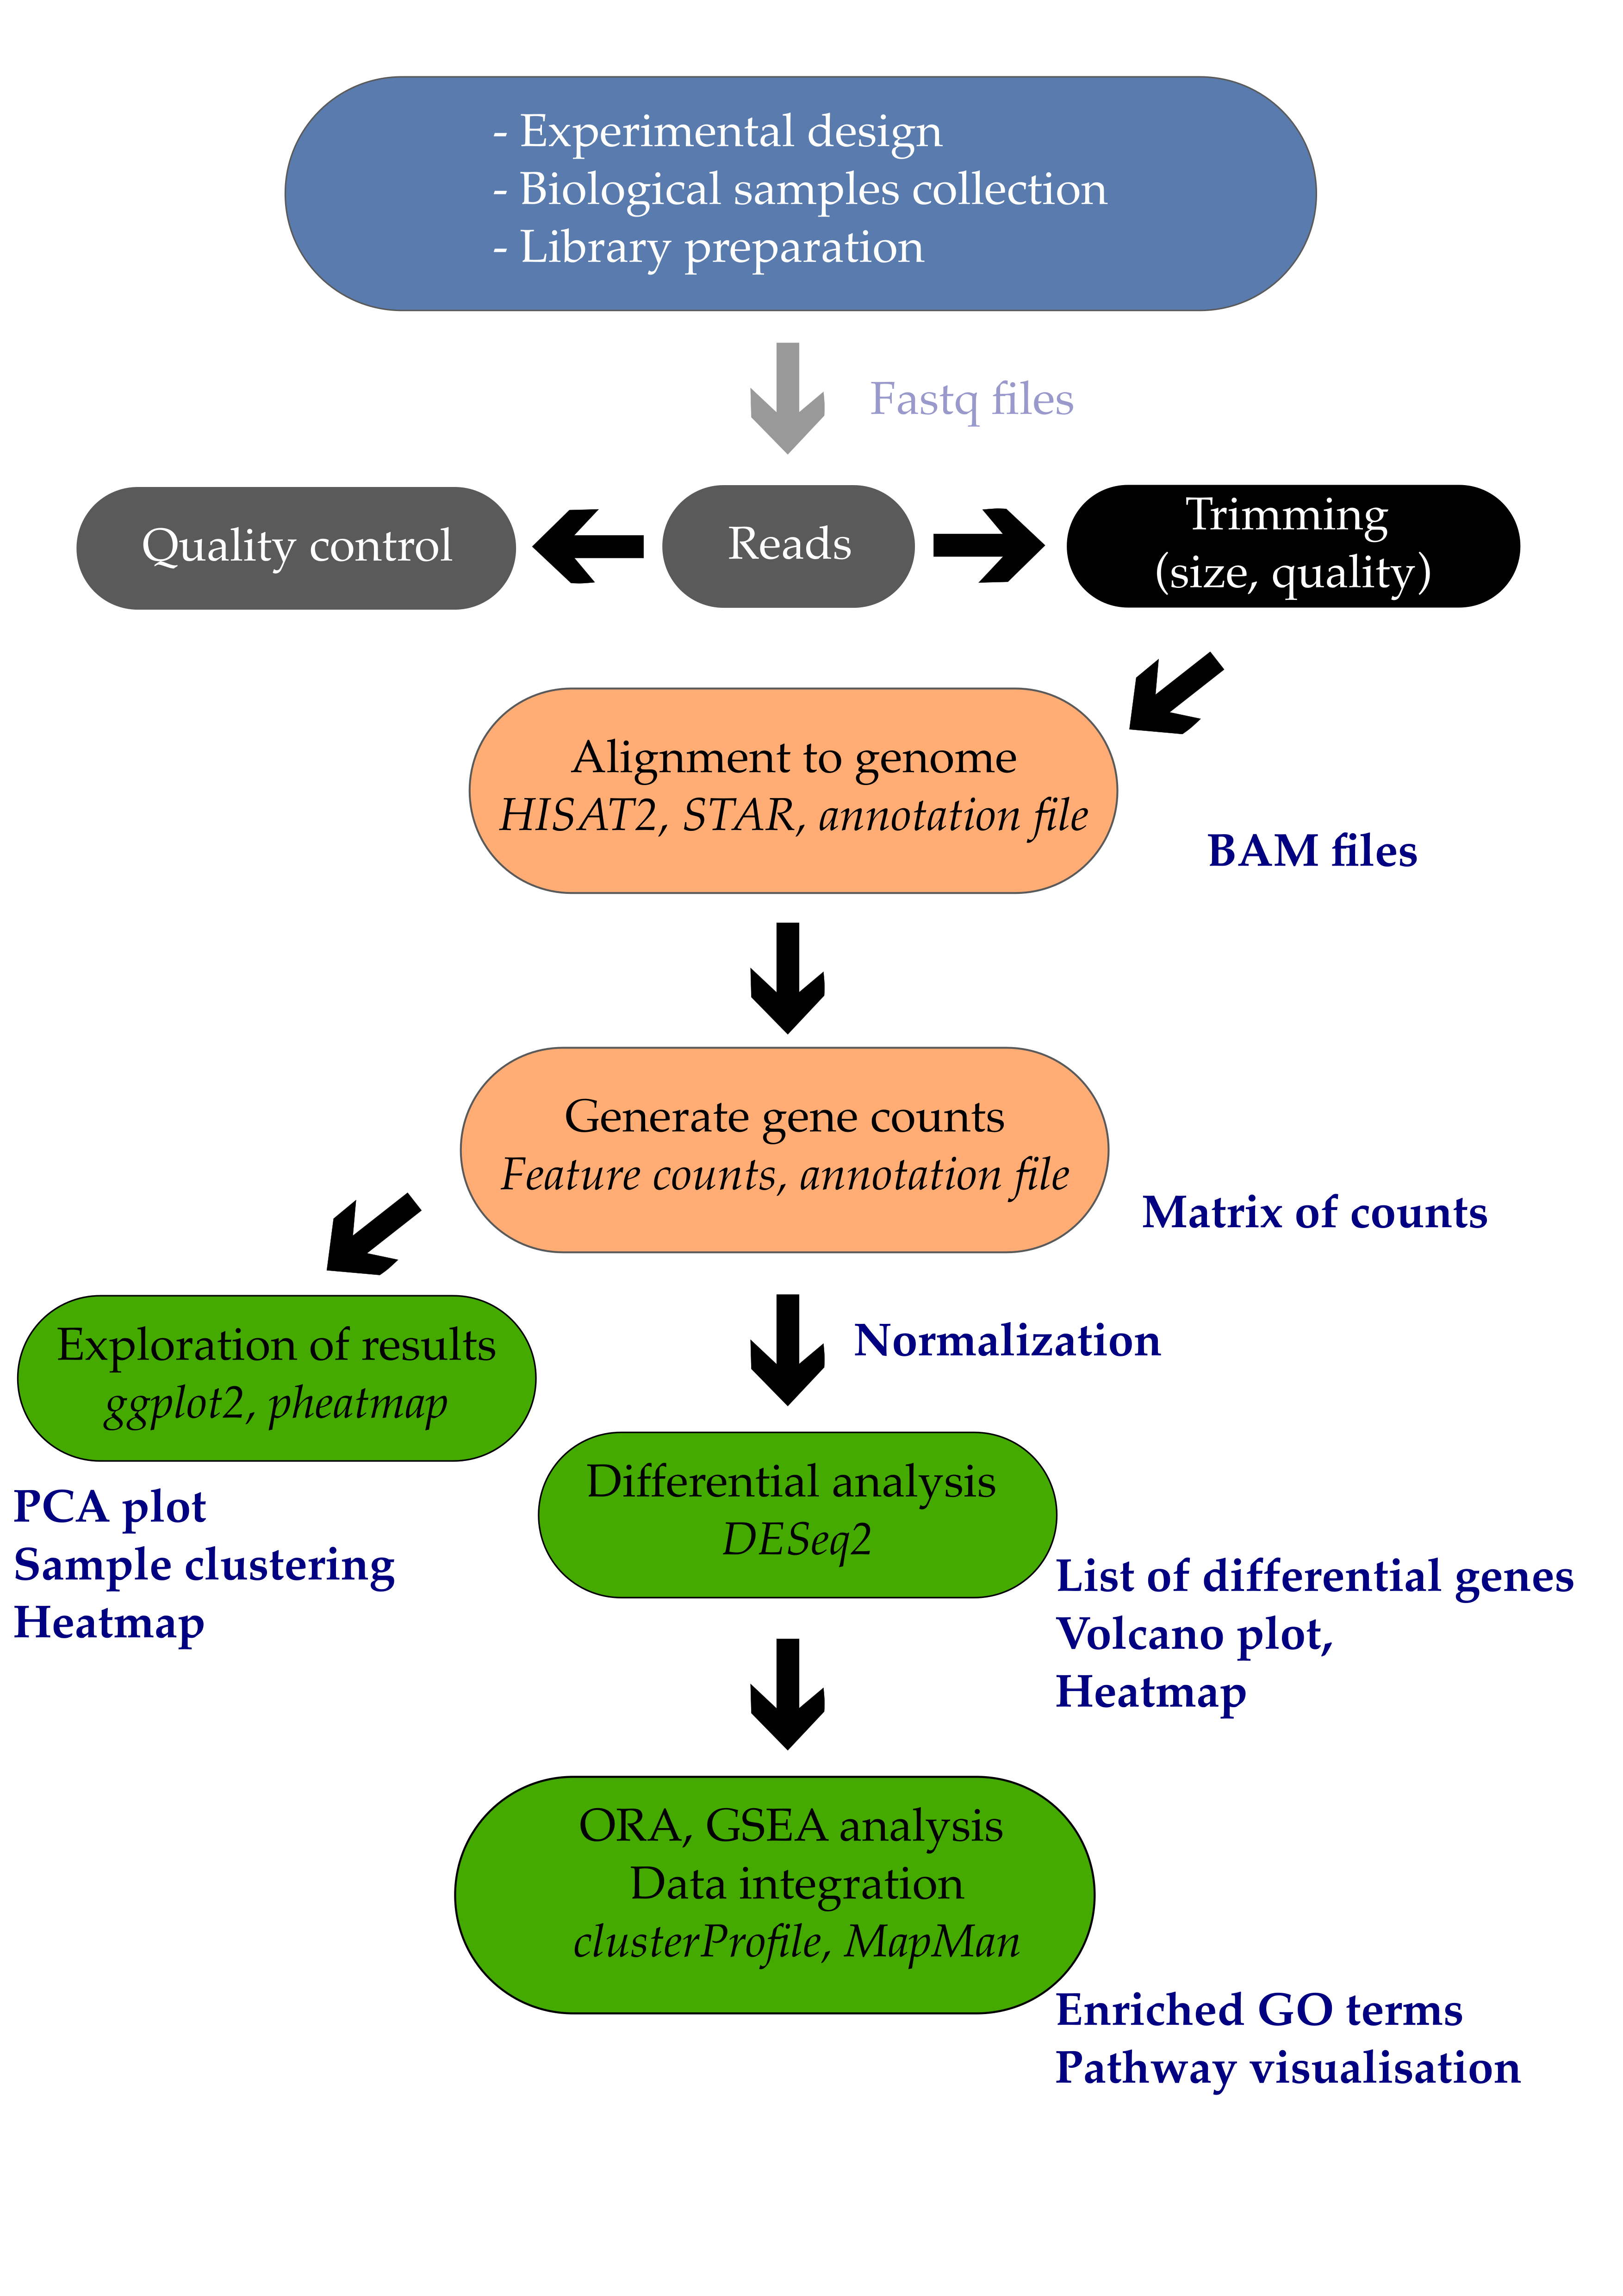
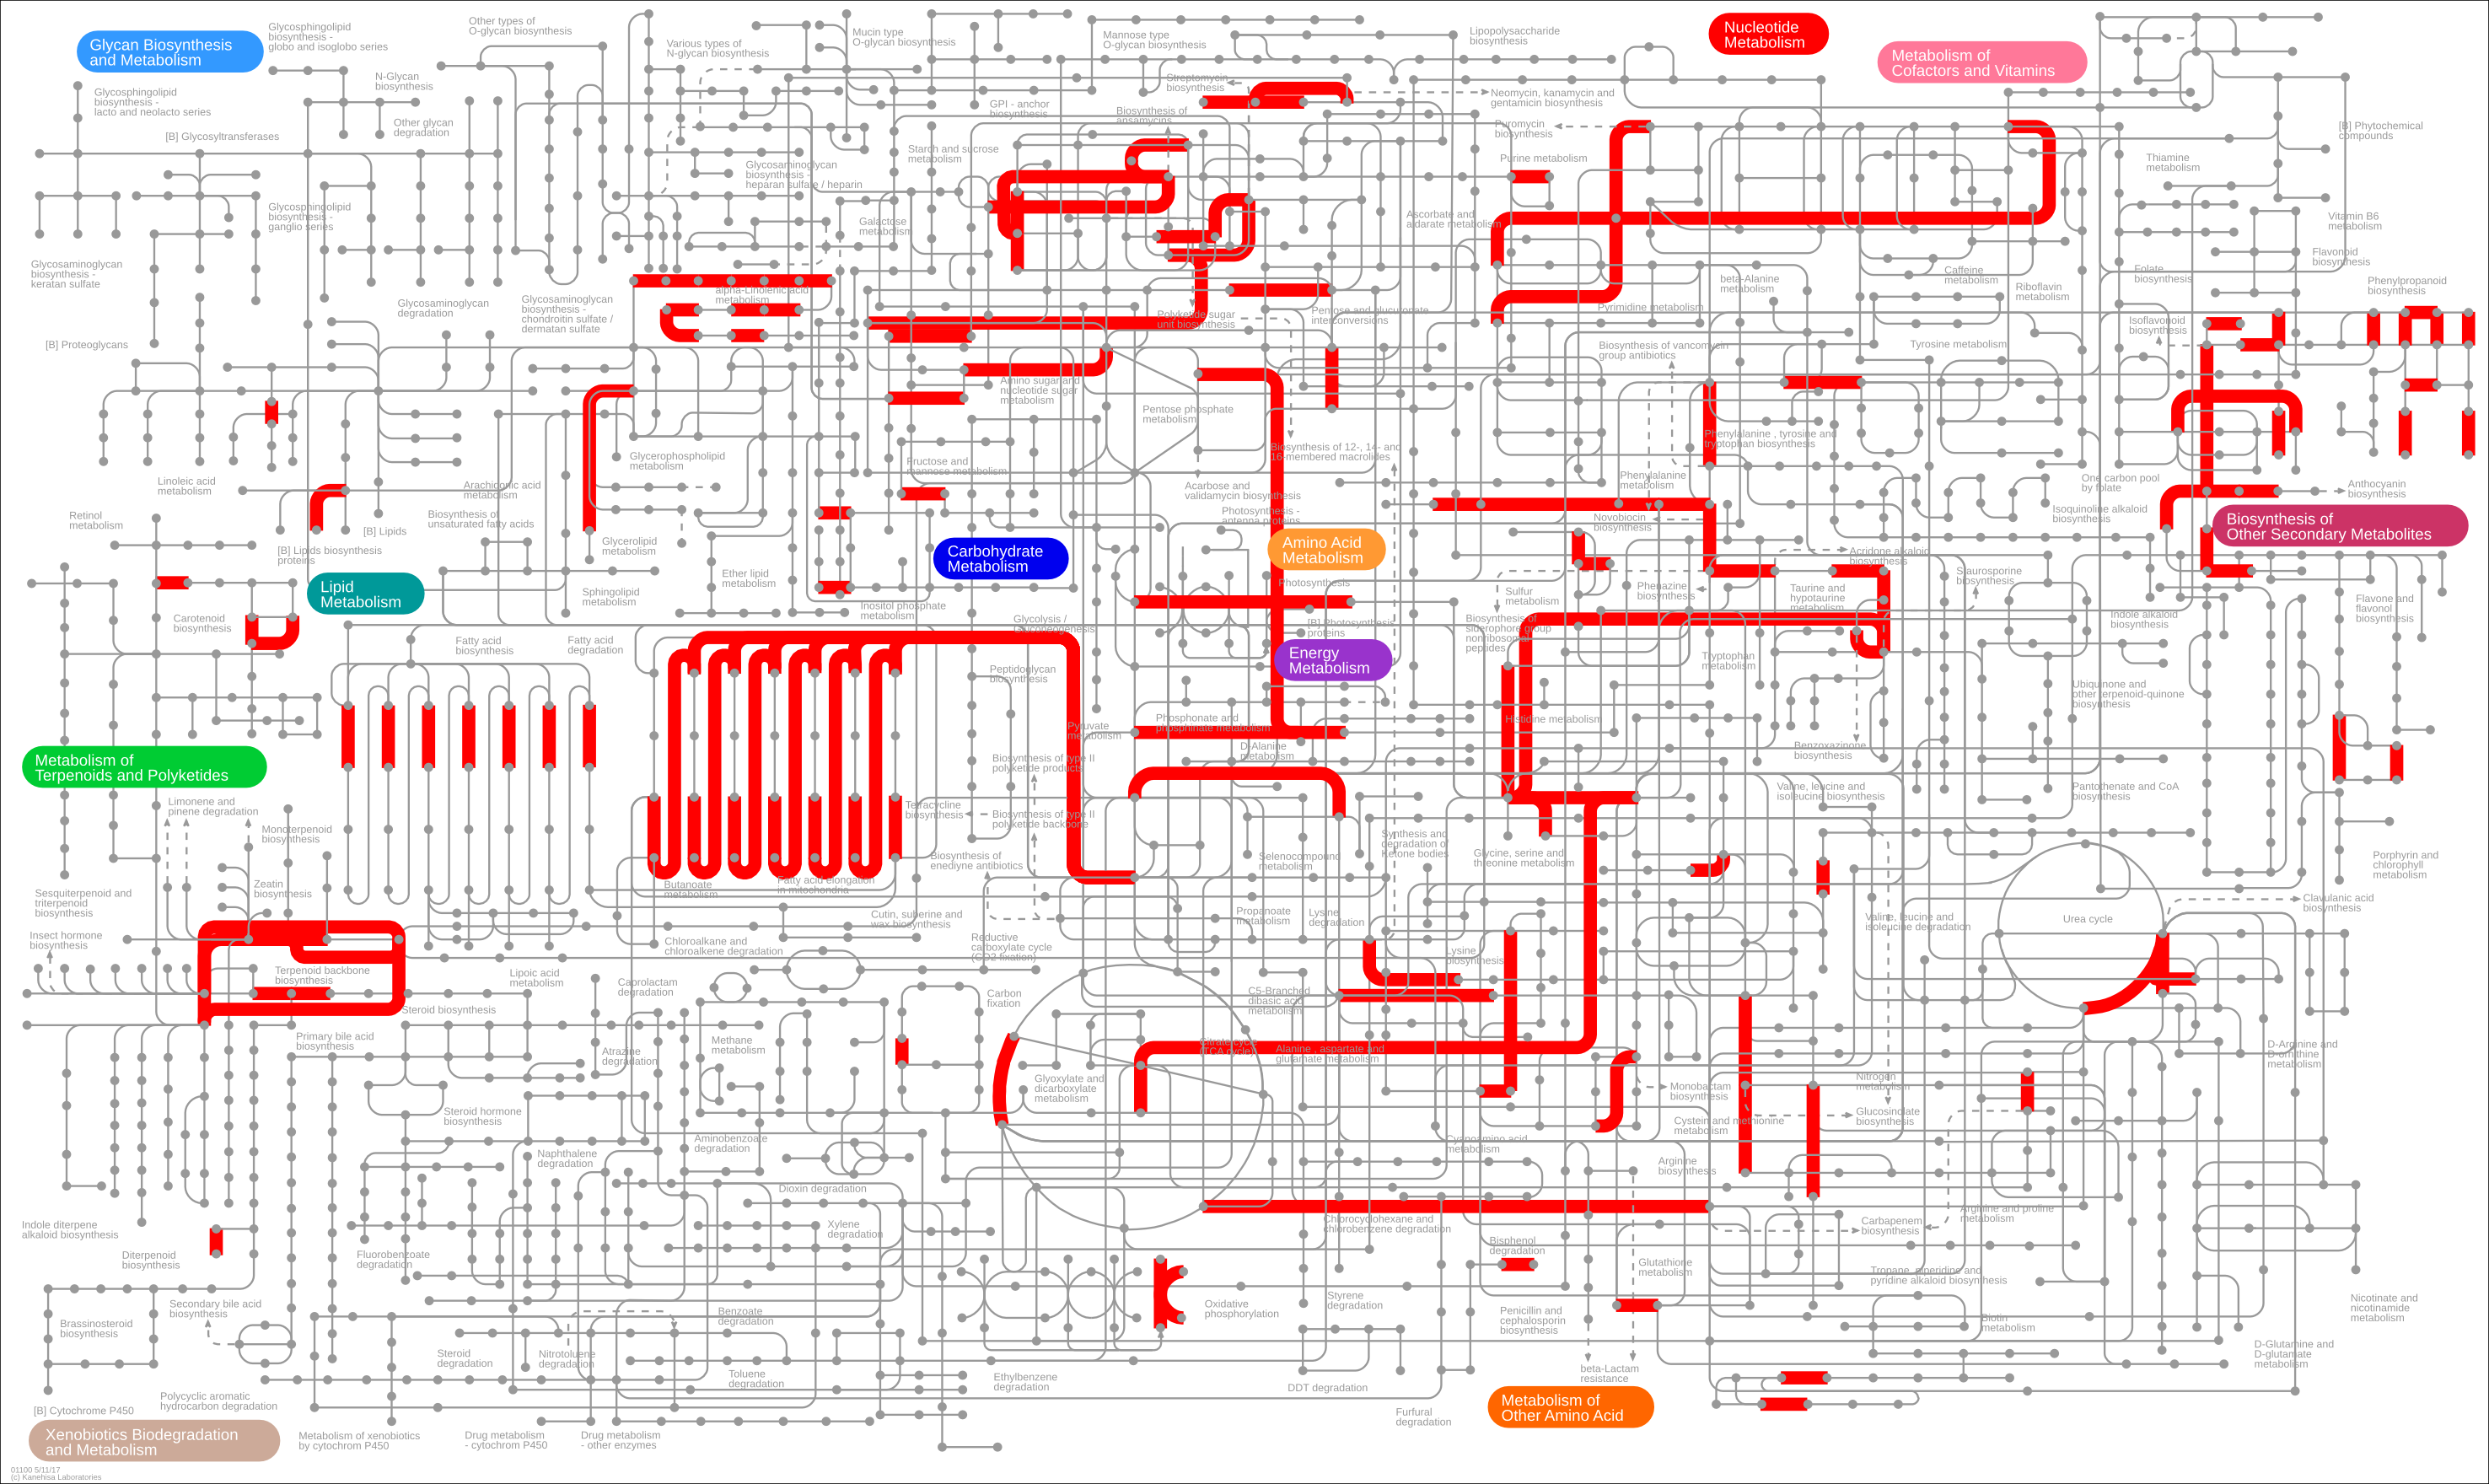
So far, we have only been mostly looking at our transcriptomic results alone. Yet, KEGG has started to give us some insight into metabolism. Let’s dig further with two tools: iPath and MapMan.
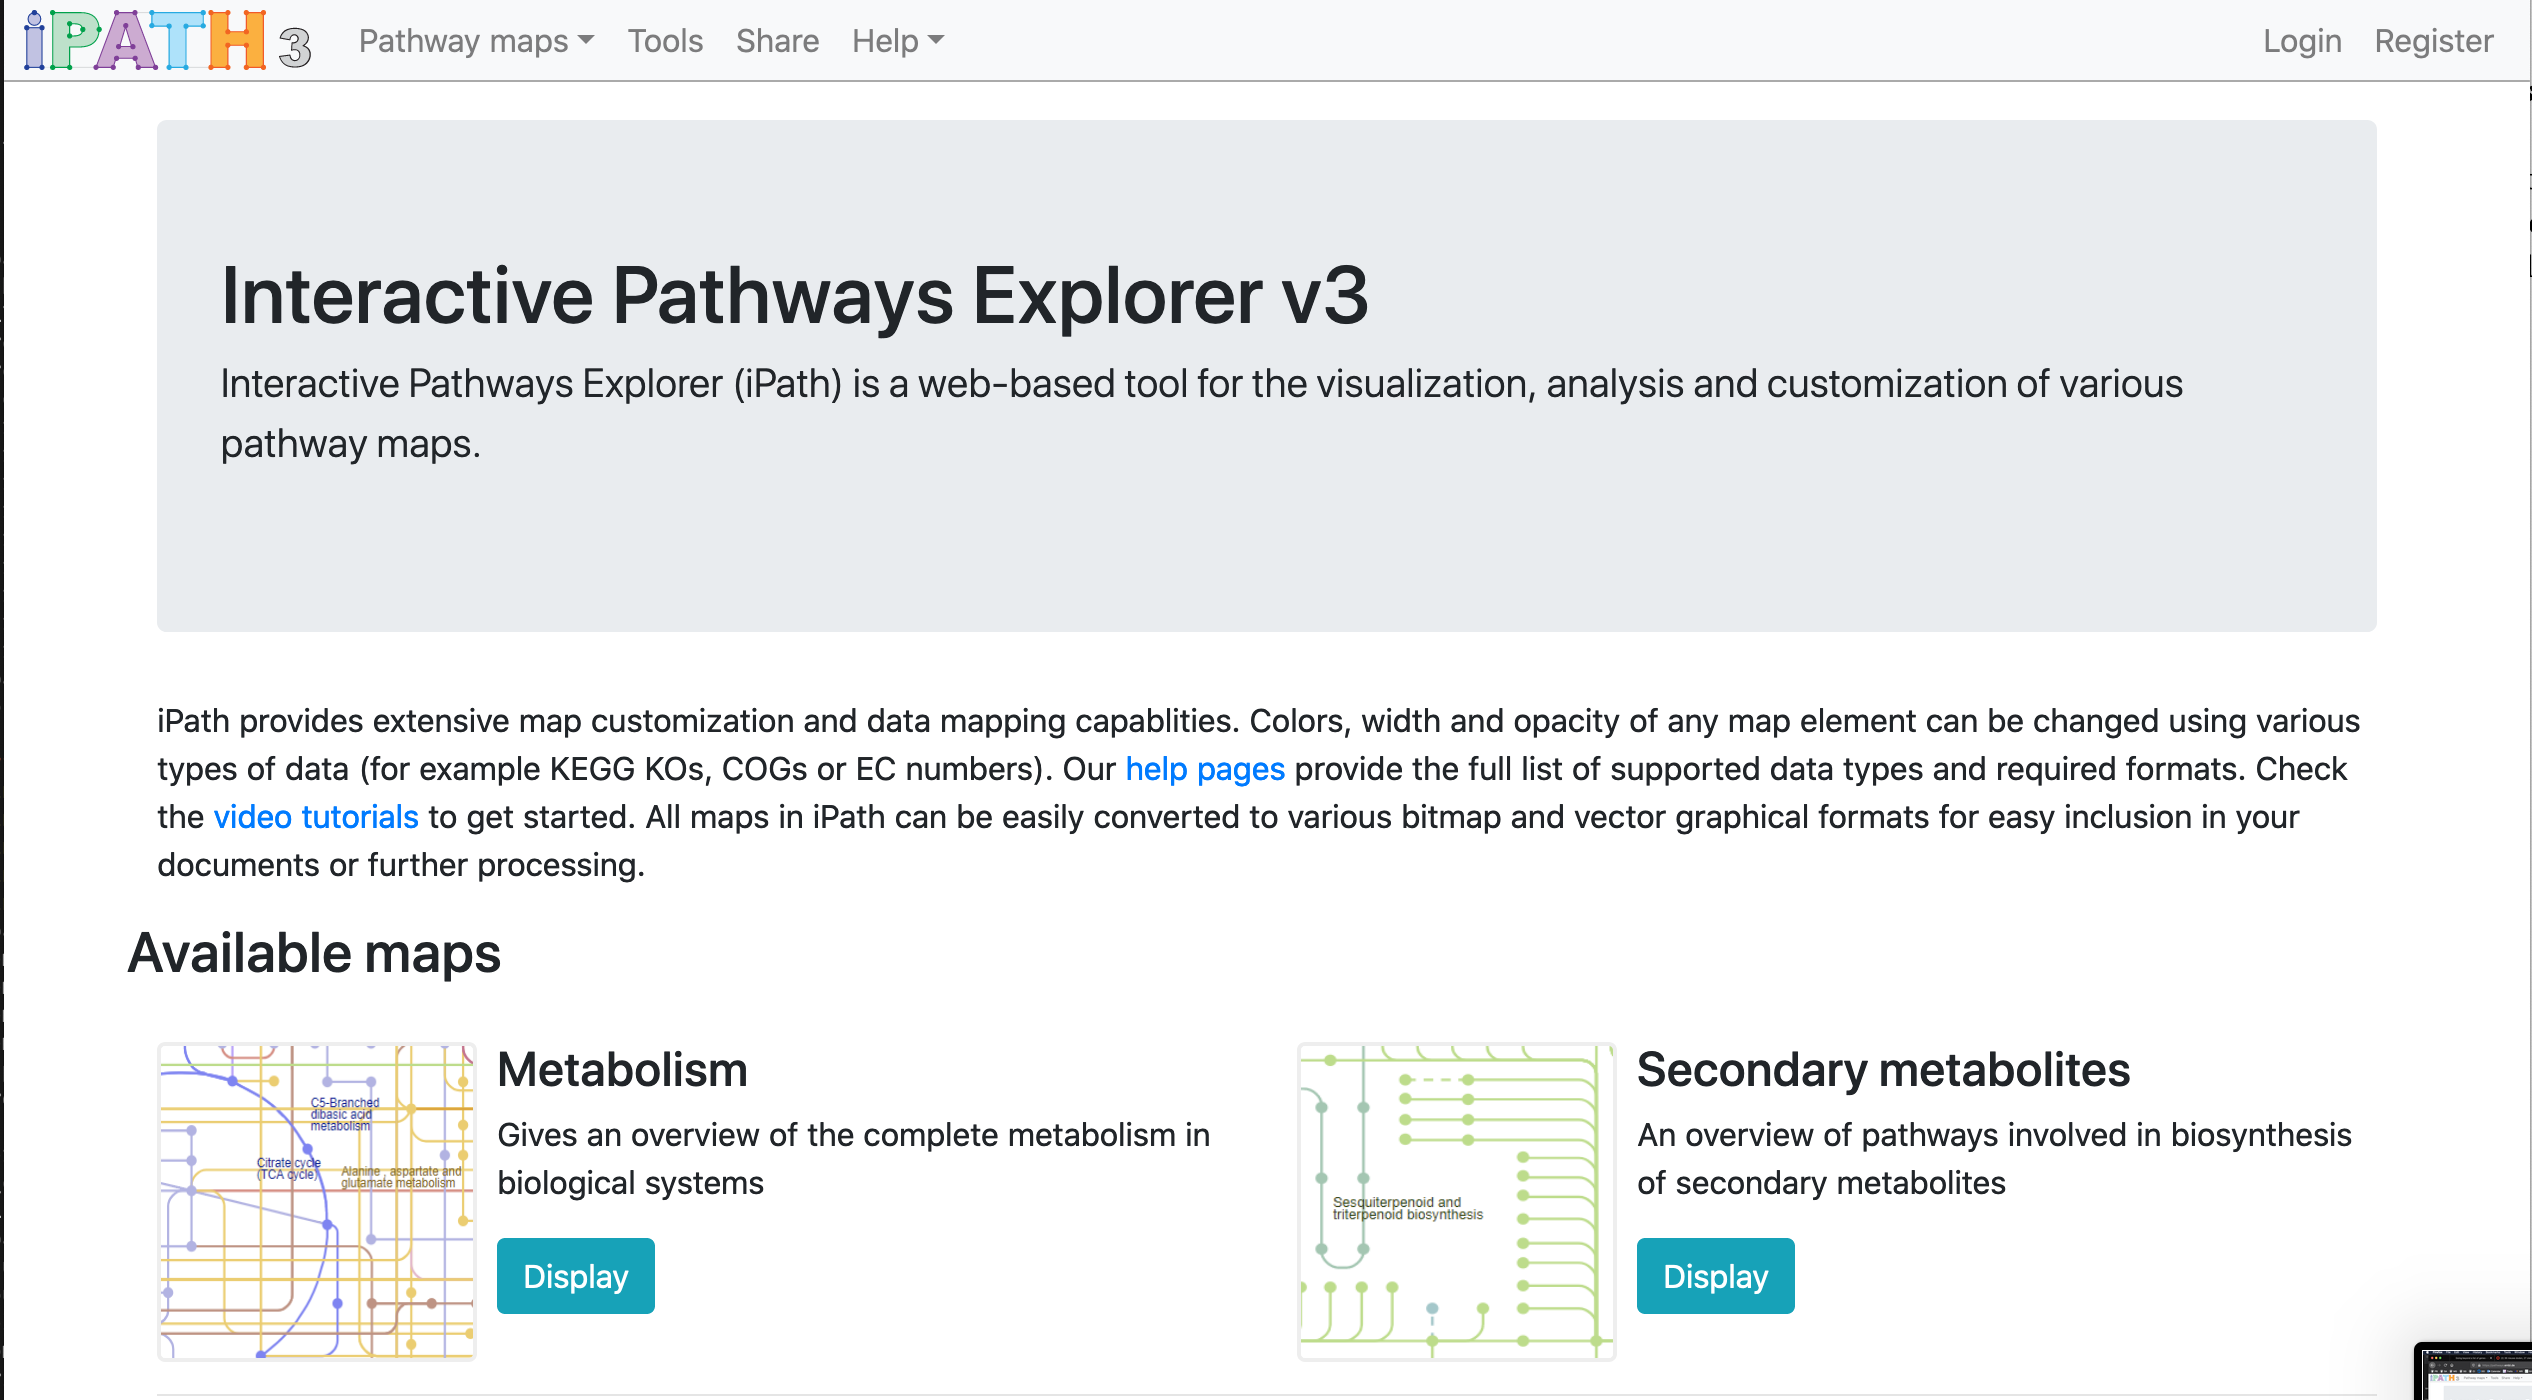
From the Interactive Pathways Explorer v3 home page:
Interactive Pathways Explorer (iPath) is a web-based tool for the visualization, analysis and customization of various pathway maps.
iPath provides extensive map customization and data mapping capablities. Colors, width and opacity of any map element can be changed using various types of data (for example KEGG KOs, COGs or EC numbers).
We will use this webtool to map our genes on metabolic pathways to provide some contextual information.
2.2 Retrieving Uniprot identifiers
From our list of differential genes We are going to generate a list of Uniprot identifiers since these are usable to visualise with iPath3 from our list of differential genes.
diff_arabidopsis_genes_annotated %>%
  filter(uniprotswissprot != "") %>%                                       # to remove genes with no matching Uniprot entries
  unique() %>%
  mutate(id_for_ipath = paste("UNIPROT",uniprotswissprot,sep = ":")) %>%   # to create an ID that iPath can use
  dplyr::select(id_for_ipath) %>%                                          # we keep only the relevant ID for further copy-pasting
  write.table(.,
    file = "diff_genes_swissprot.tsv",
    row.names = FALSE,
    quote = FALSE)
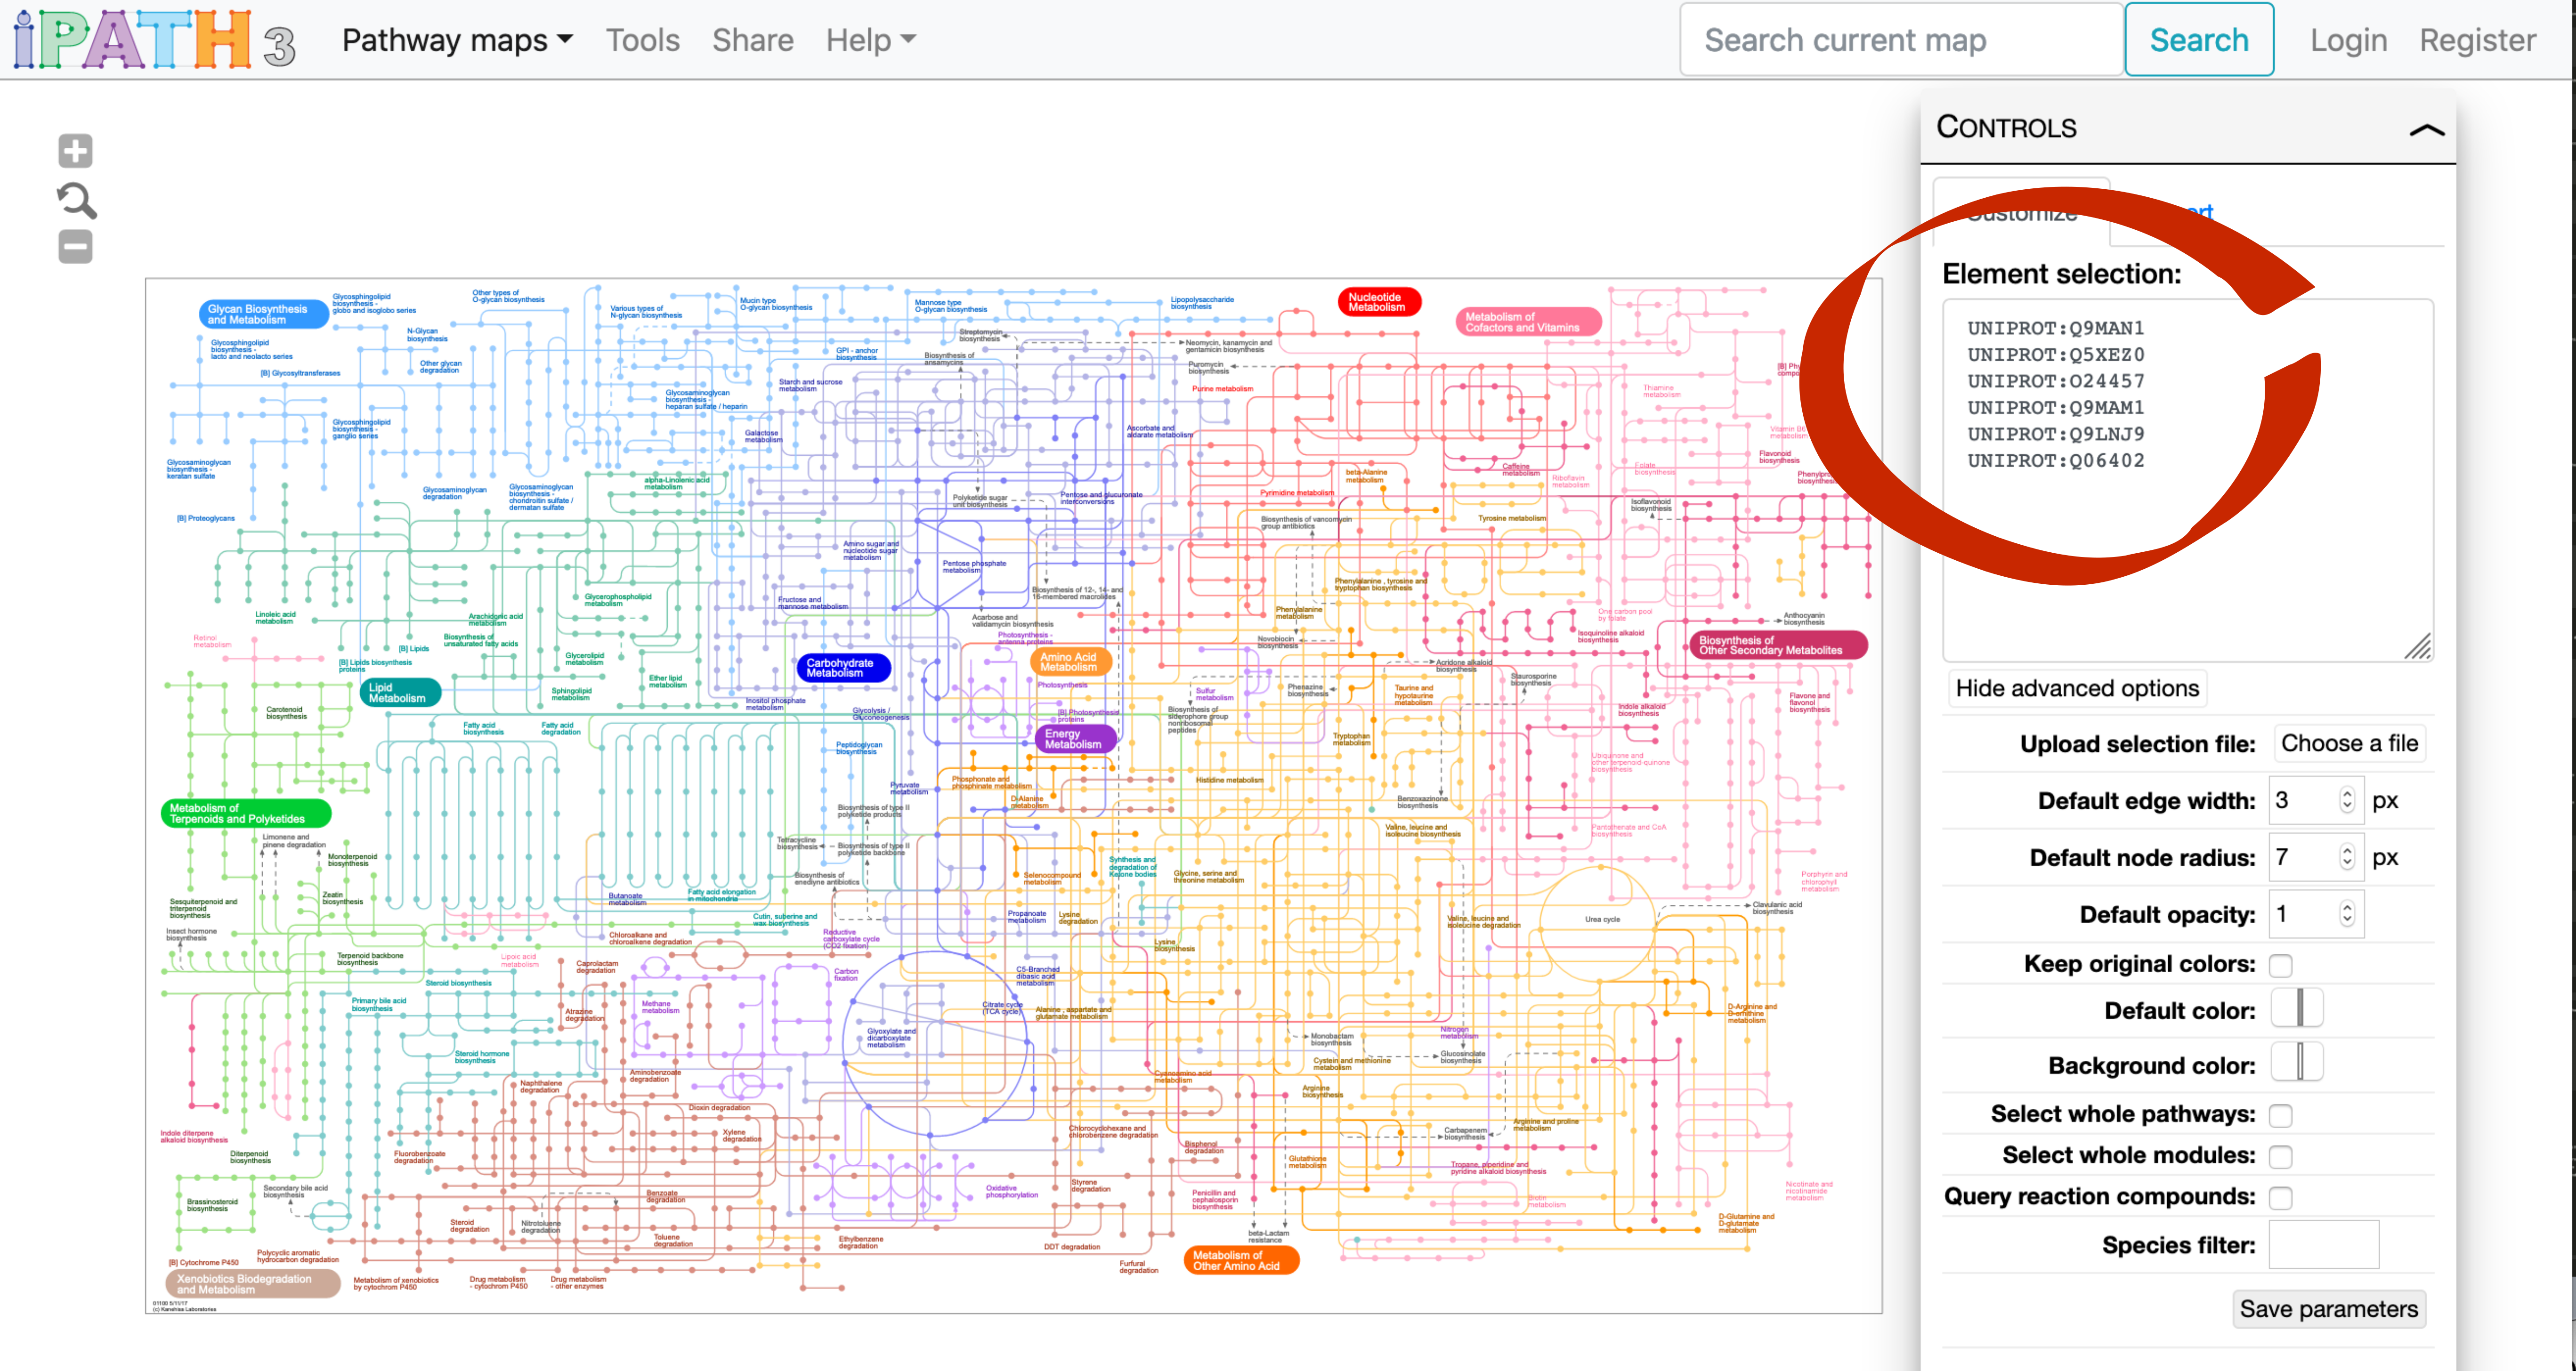
If you open the diff_genes_swissprot.tsv file in a text editor, this is what you should see.
id_for_ipath
UNIPROT:Q9MAN1
UNIPROT:Q5XEZ0
UNIPROT:O24457
UNIPROT:Q9MAM1
UNIPROT:Q9LNJ9
UNIPROT:Q06402
... more lines ....
We can copy-paste this list in the box to the right.
If you then click on the “Submit data” button, you should see the following reactions highlighted.
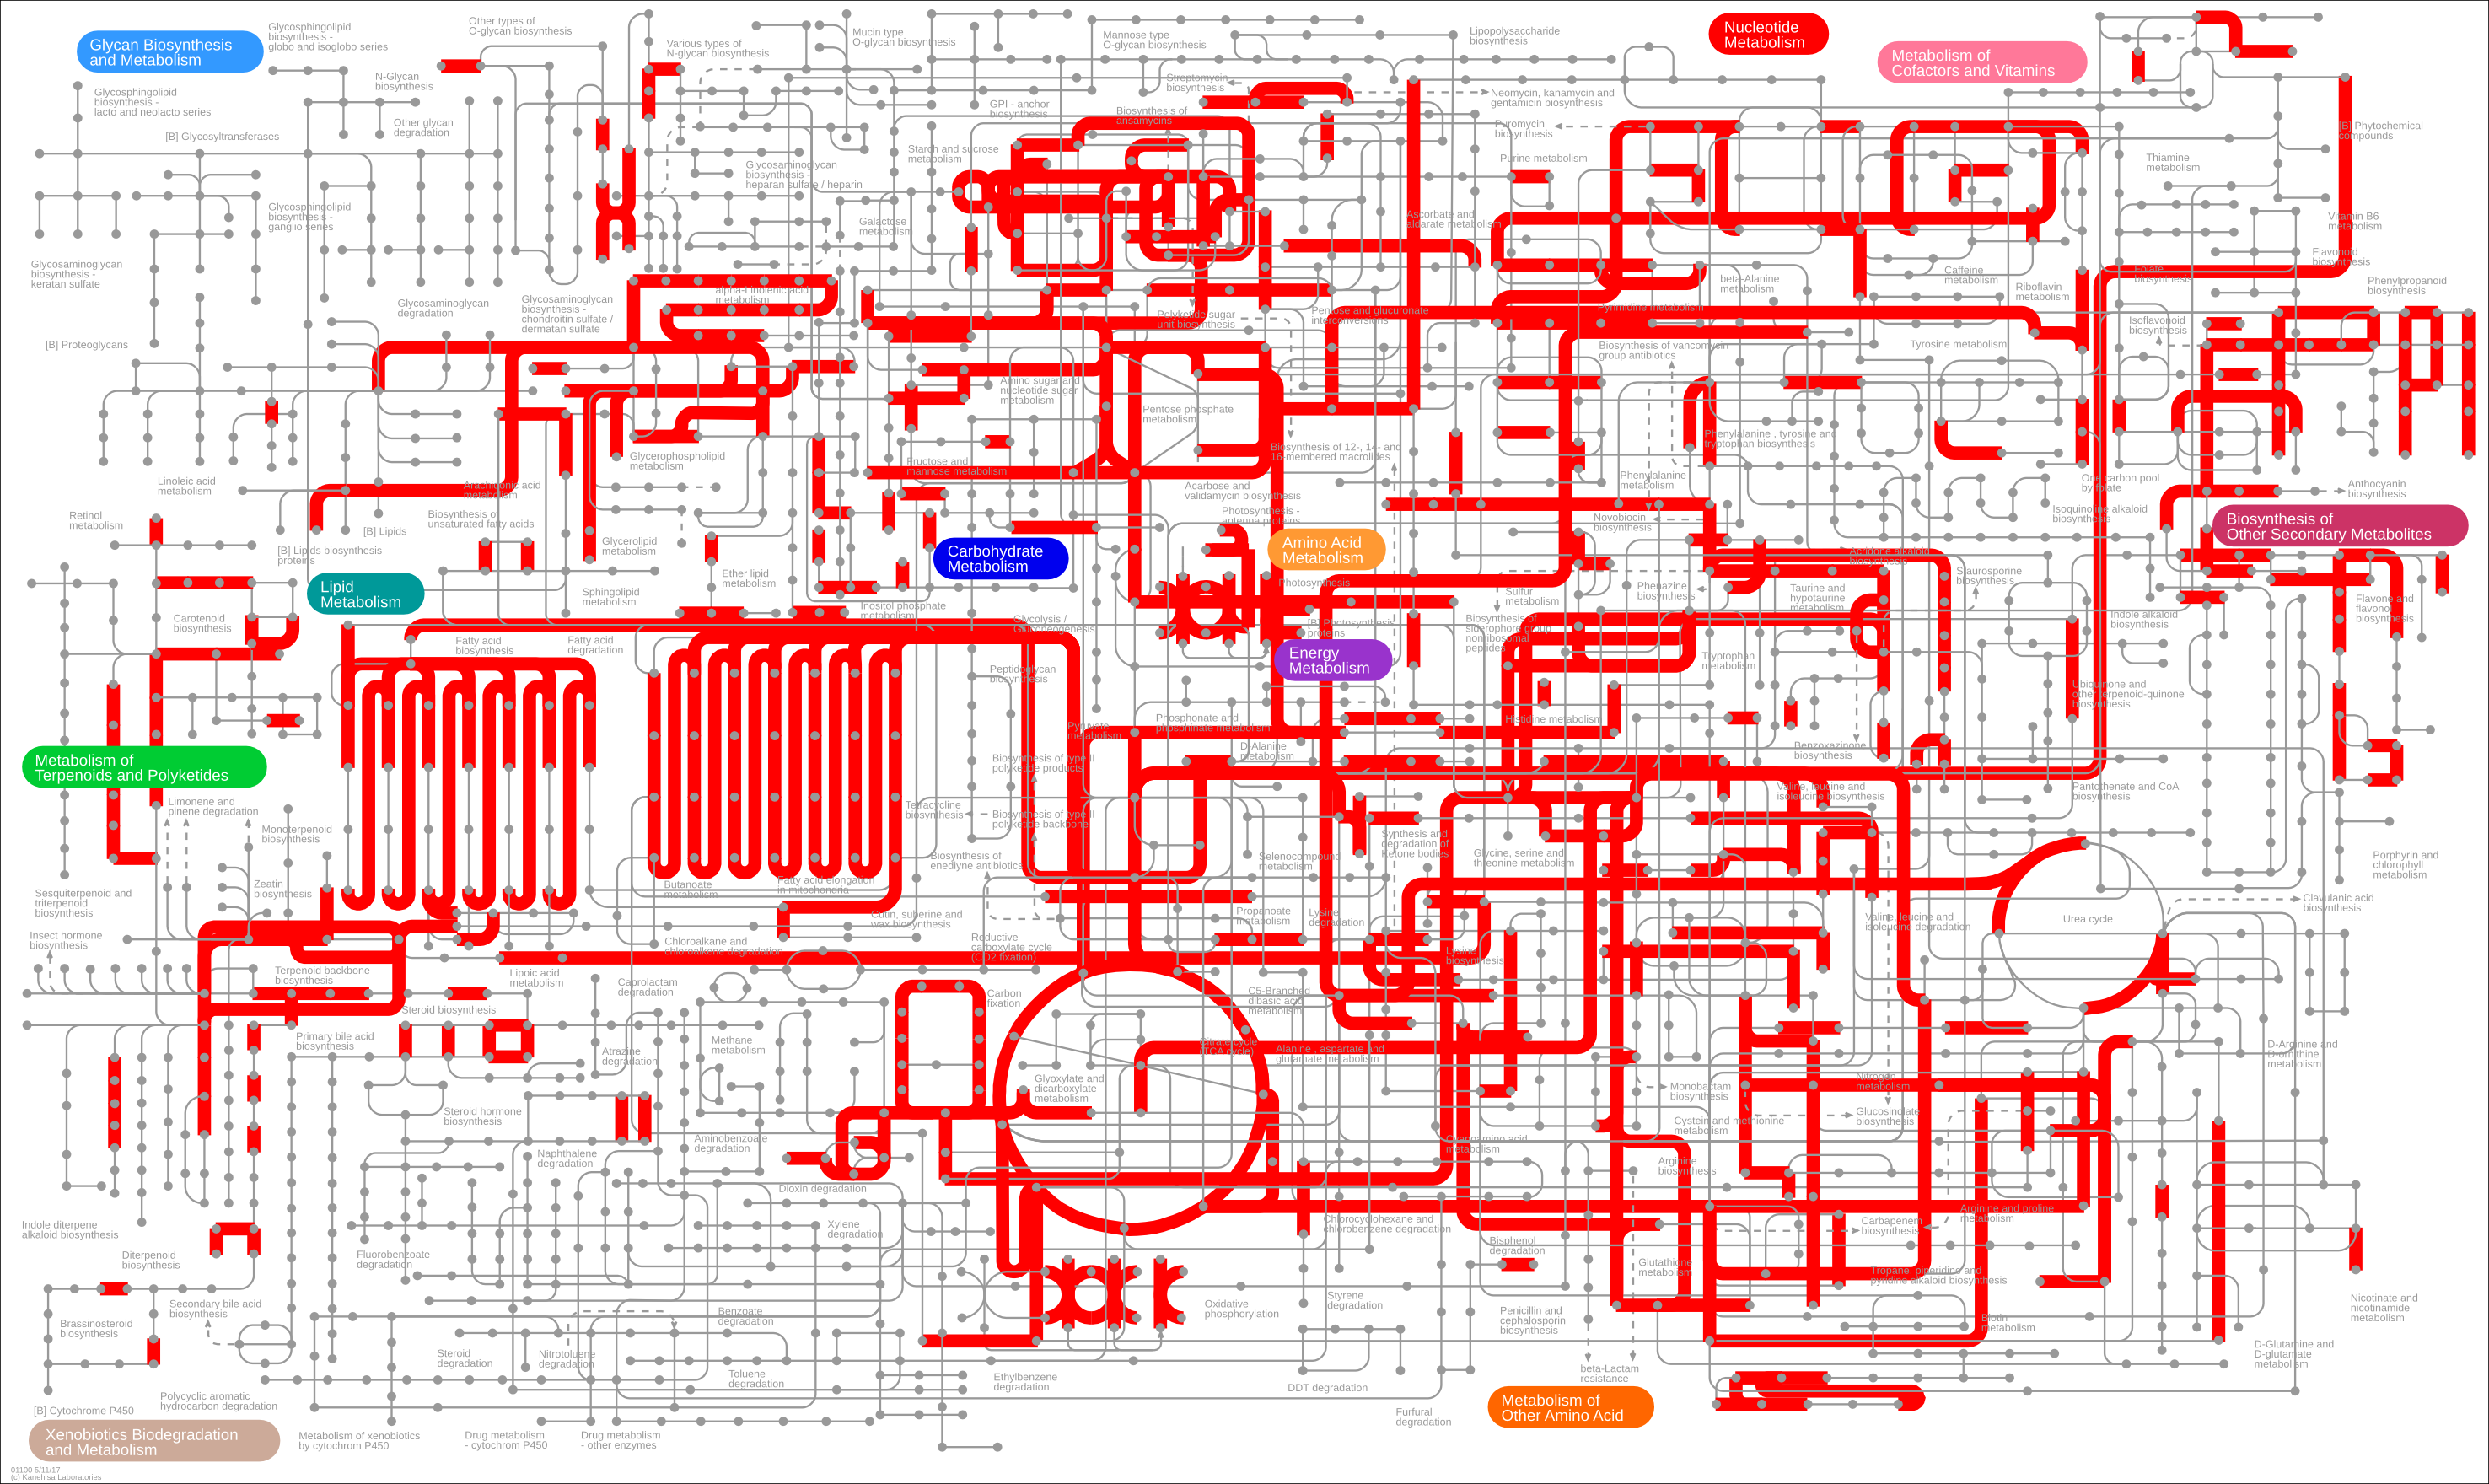
Ok, there is a lot of information there and possibly too much. Let’s filter out some genes based on their \(\log_{2}\) fold change.
We can calculate the median, 75th percentile and the 90th percentile of our fold changes.
diff_genes %>%
  filter(log2FoldChange > 0) %>%
  with(.,quantile(log2FoldChange, c(0.5,0.75,0.9)))
50%       75%       90%
0.8695469 1.6819535 3.2561618
Since 75% of the genes with a positive \(\log_{2}\) fold change have a value lower than 1.68, we are going to keep the genes with a higher fold change.
diff_genes_filtered =
  diff_genes %>%
  filter(log2FoldChange > quantile(log2FoldChange, 0.75))

# we query Ensembl again to retrieve the attributes
# attributes_to_retrieve = c("tair_symbol", "uniprotswissprot","entrezgene_id")
diff_arabidopsis_genes_annotated_2 <- biomartr::biomart(genes = diff_genes_filtered$genes,
                                                      mart       = "plants_mart",
                                                      dataset    = "athaliana_eg_gene",
                                                      attributes = attributes_to_retrieve,
                                                      filters =     "ensembl_gene_id" )

diff_arabidopsis_genes_annotated_2 %>%
  filter(uniprotswissprot != "") %>%
  unique() %>%
  mutate(id_for_ipath = paste("UNIPROT",uniprotswissprot,sep = ":")) %>%
  dplyr::select(id_for_ipath) %>%
  write.table(., file = "diff_genes_swissprot_2.tsv", row.names = FALSE, quote = FALSE)
In your diff_genes_swissprot_2.tsv file, you should have less entries now which will make the map slightly clearer.
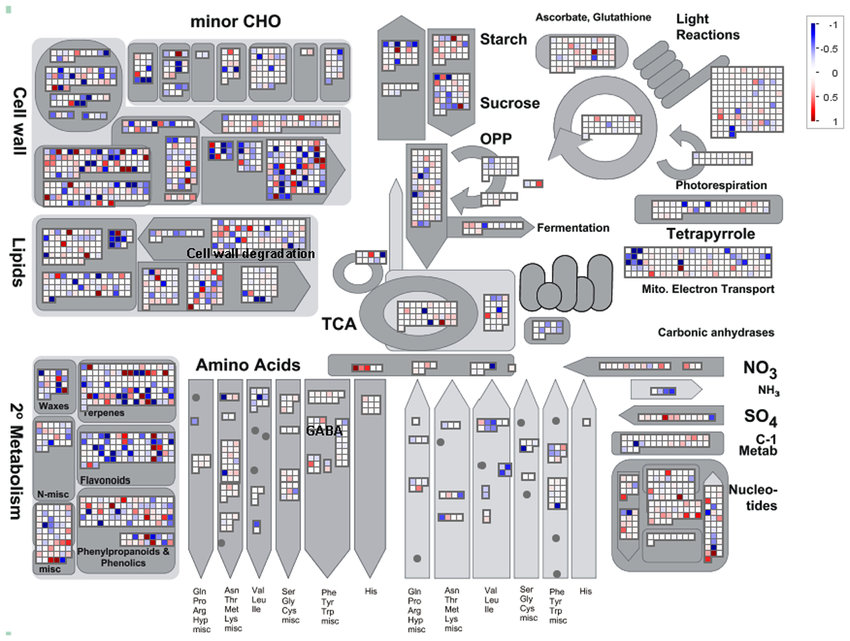
5.2 MapMan
MapMan is a standalone software that you can install on your laptop to create insightful metabolic visualisation of transcriptomic, proteomic and/or metabolic data.
From Schwacke et al., 2019:
The MapMan framework was developed specifically for plants with the design goal to facilitate the visualization of omicsdata on plant pathways (Thimm et al., 2004). MapMan uses a simple hierarchical tree structure of terms referred to as ‘‘bins,’’ which describe biological contexts/concepts.
Major biological processes (e.g., photosynthesis) are encompassed in top-level bins, and each child bin represents a more narrowly focused subprocess or component within the context of the parent bin. Assignment of proteins to the lowest-level (i.e., leaf) bins was preferred in order to make the annotation as precise as possible, although assignment to abstract higher-level bins was supported.
Proteins were mostly assigned to a single bin, but for some proteins with functions in diverse biological processes it wasnecessary to correspondingly assign to multiple bins.
5.2.1 Requirements
You will need to create an account first and download the proper MapMan installation for your OS here. I’d recommend to download the latest stable version (not the “release candidate”).
You will then have to download the so-called “mapping file” which is an ontology relating genes to functional bins. You can also generate your own classification for your species of interest with the Mercator webtool. You’ll need to supply a fasta file containing your transcripts or your protein of interest.
The latest list of available mappings is here.
5.2.2 Pathway visualisation
One of the most used visualisation is the global overview of the metabolism. Up-regulated genes are shown in red and genes down-regulated in blue.
6. Other data mining tools
6.1 ThaleMiner
https://bar.utoronto.ca/thalemine/begin.do
6.2 Expression atlas
https://www.ebi.ac.uk/gxa/home
6.3 BAR
6.4 CoExprViz
http://bioinformatics.psb.ugent.be/webtools/coexpr/
7. Troubleshooting
If biomart refuses to query Ensembl again, run this command:
biomaRt::biomartCacheClear() # to solve a known bug https://github.com/BioinformaticsFMRP/TCGAbiolinks/issues/335
This will clean the cache memory and allow to perform the Ensembl query again.
8. Going further
8.1 Useful links
8.2. References
- The Cluster Profiler companion book, a great place to start
- Zhou et al. (2019). Metascape provides a biologist-oriented resource for the analysis of systems-level datasets. Nat Commun 10, 1523 (2019). link
- Yates et al. (2020) Ensembl 2020, Nucleic Acids Research, Volume 48, Issue D1, 08 January 2020, Pages D682–D688, Link
- Tian et al. (2017) agriGO v2.0: a GO analysis toolkit for the agricultural community. Nucleic Acids Research, Volume 45, Issue W1, Pages W122–W129.Link
- MapMan: MapMan4: A Refined Protein Classification and Annotation Framework Applicable to Multi-Omics Data Analysis. Schwacke et al. Molecular Plant, 12(6):879-892
- Drost et al. (2017) Biomartr: genomic data retrieval with R. Bioinformatics 33(8): 1216-1217. doi:10.1093/bioinformatics/btw821.
- Darzi et al. (2018) iPath3.0: interactive pathways explorer v3. Nucleic Acids Research, Volume 46, Issue W1, 2 July 2018, Pages W510–W513, link
Key Points
Transcriptomic data integration with metabolic pathways require to map gene identifiers to pathway the correspondence