conda config --add envs_dirs /zfs/omics/projects/bioinformatics/software/miniconda3/envs/pycirclize
Introduction
pyCirclize is a circular visualization python package based on matplotlib (Shimoyama 2022). This package is developed for the purpose of easily and beautifully plotting circular figure such as Circos Plots and Chord Diagrams in Python. In addition, useful genome and phylogenetic tree visualization methods for the bioinformatics field are also implemented.
Installation
Installed on Crunchomics: Yes,
- The pycirclize conda environment is part of the bioinformatics share. If you have access to Crunchomics and have not yet access to the bioinformatics share, then you can send an email with your Uva netID to Nina Dombrowski, n.dombrowski@uva.nl.
- Afterwards, you can add the bioinformatics share as follows (if you have already done this in the past, you don’t need to run this command):
If you want to install it yourself, you can run:
mamba create -p pycirclize -c bioconda -c conda-forge python=3.10.12 pycirclize numpy matplotlibUsage
You can easily generate custom plots using pycirclize in python after activating the environment with conda activate pycirclize. To get started, you can view more instructions here.
Additionally, we provide a small python wrapper, that can take a Prokka gbk (possibly others, however, that was not tested yet) and generate a circos plot that will look something like this:
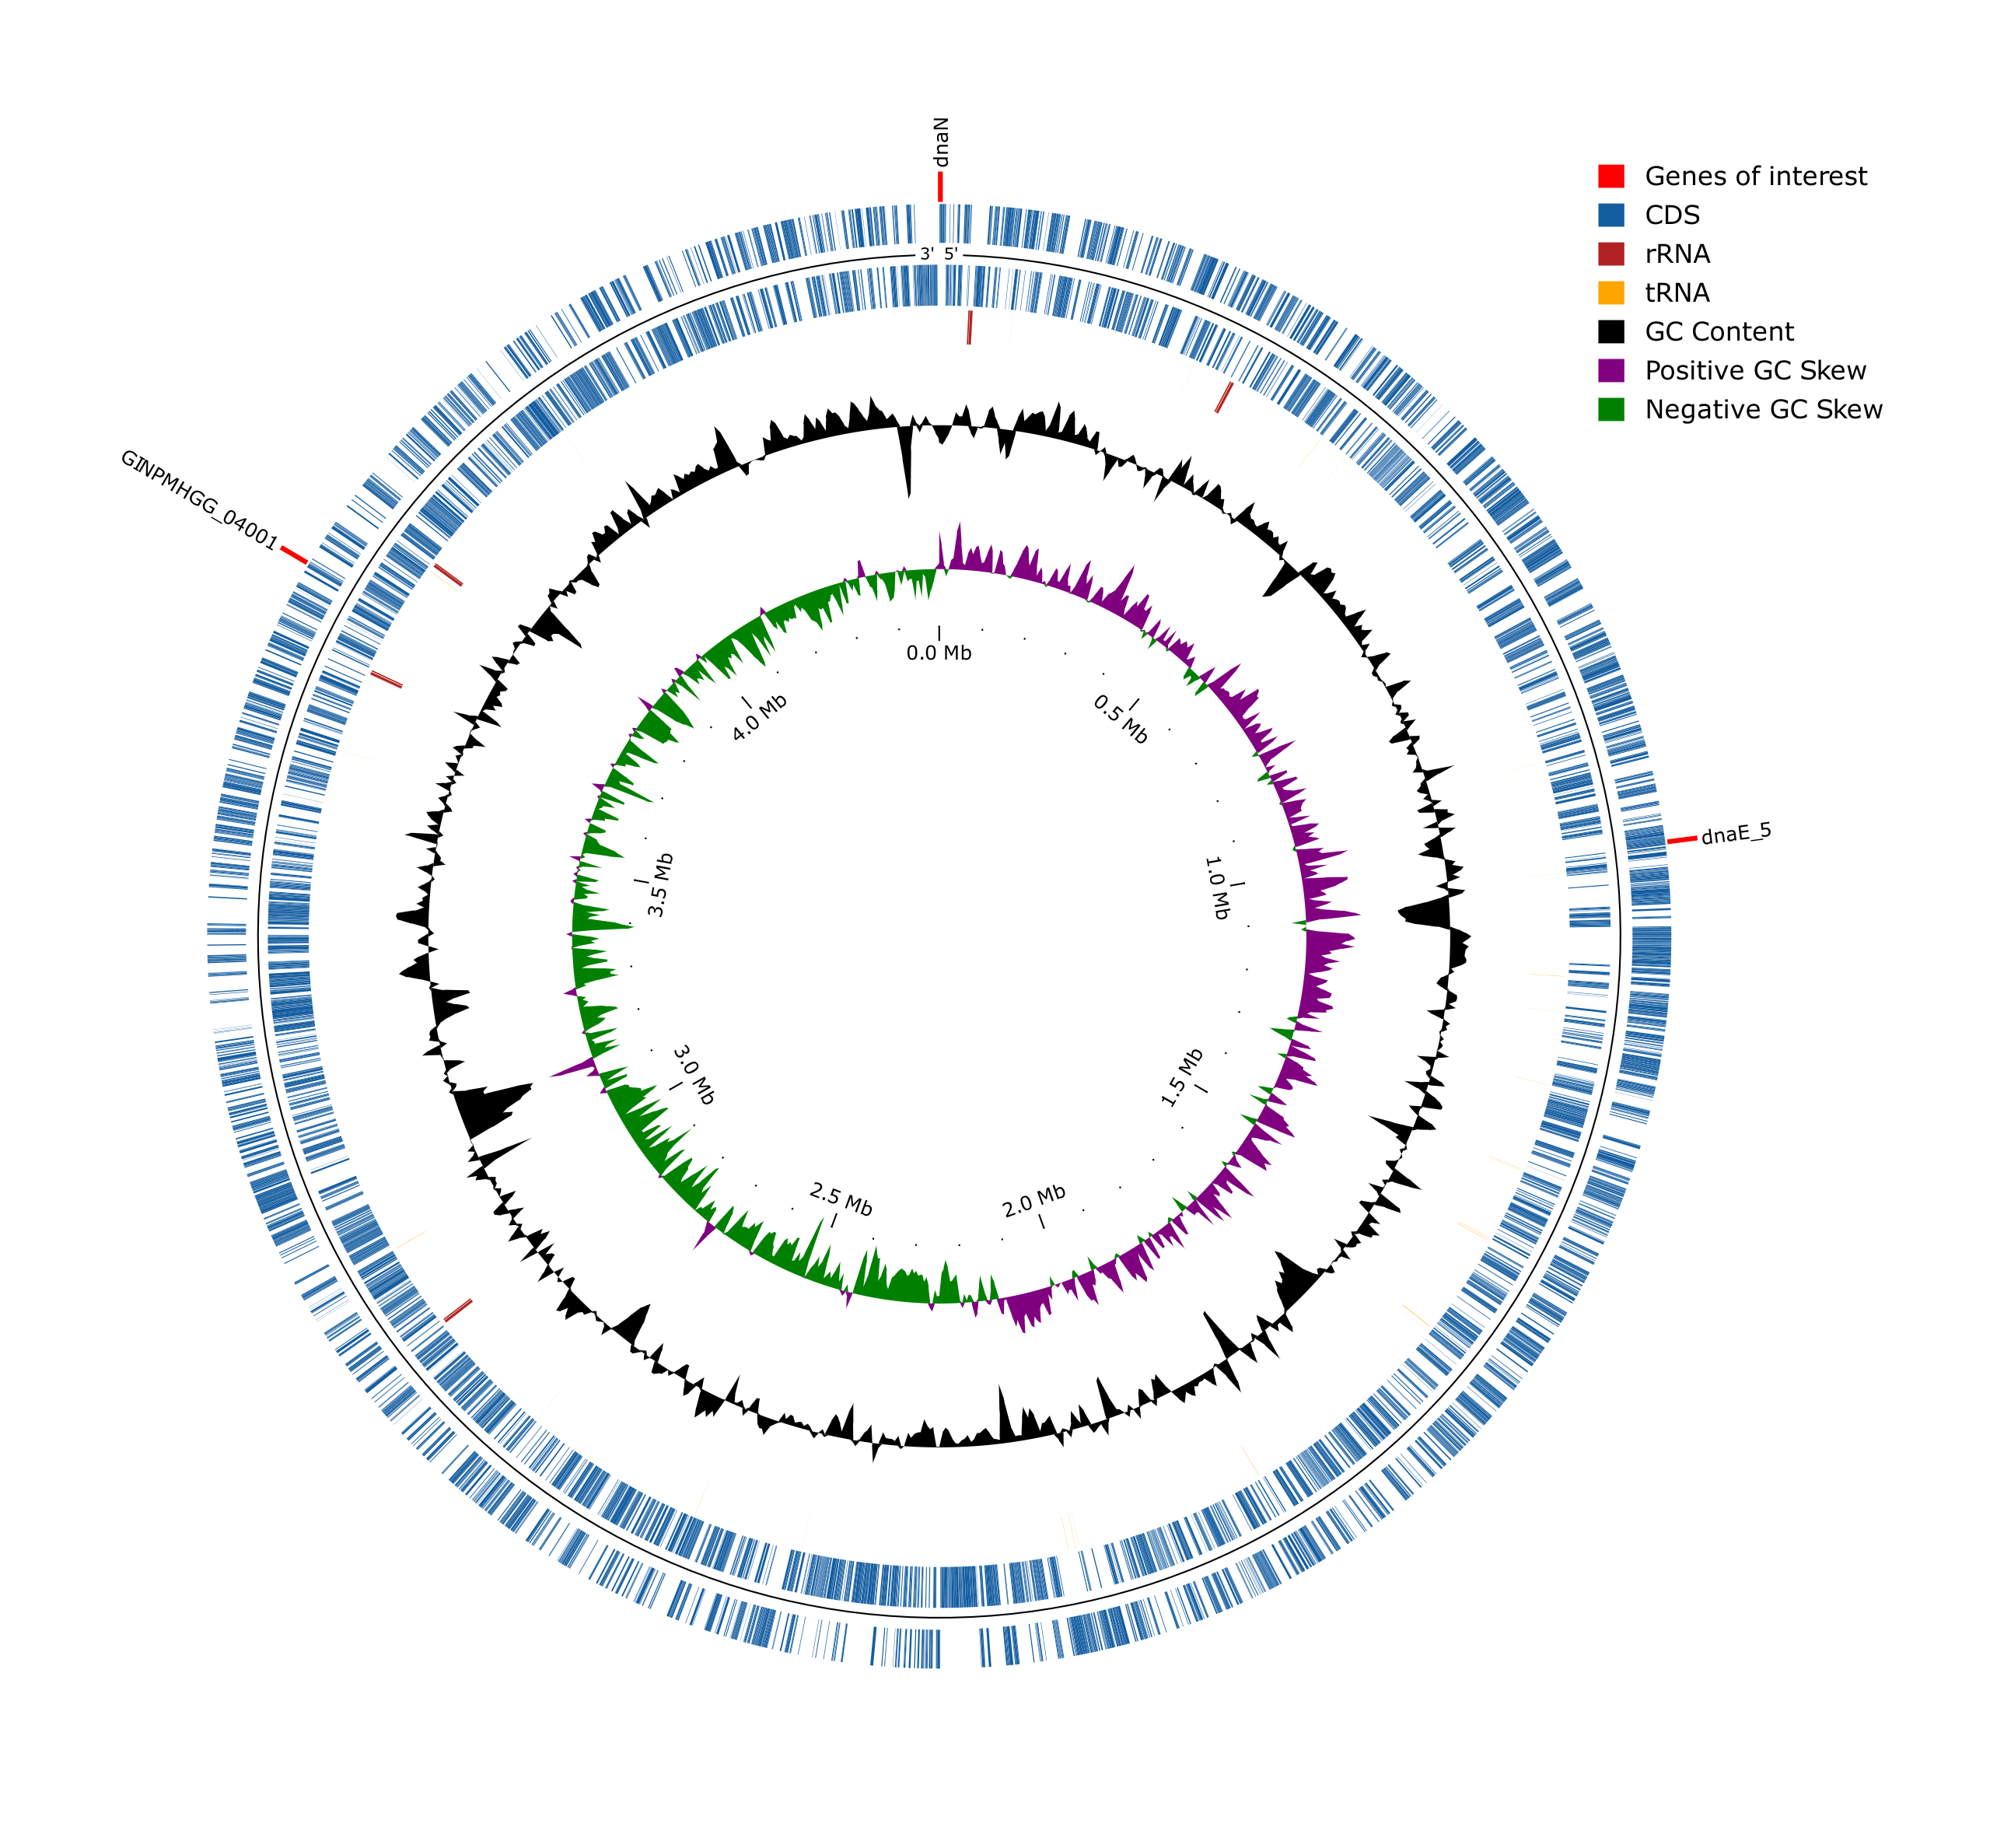
conda activate pycirclize

python /zfs/omics/projects/bioinformatics/scripts/generate_circos_plot.py \
    -i dnaapler.gbk \
    -o circos_plot.pdf \
    -g genes_of_interest.txt

conda deactivate
Settings:
-h,--helpshow this help message and exit-iINPUT,--inputINPUT Input GenBank file generated by Prokka (.gbk)-oOUTPUT,--outputOUTPUT Output PDF file (.pdf)-gGENES,--genesGENES Text file containing prokka IDs of genes of interest that should be added to the plot (one gene per line). This setting is optional.--versionshow program’s version number and exit
References
Shimoyama, Yuki. 2022. pyCirclize: Circular Visualization in Python. https://github.com/moshi4/pyCirclize.